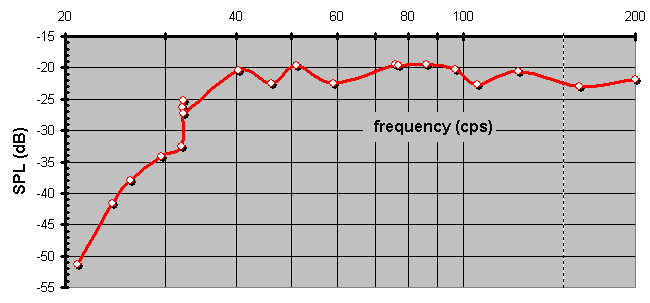
My room test of bass response is a nonprofessional attempt to measure what I was hearing. I used my computer after failing to locate an alternative. I couldn't hook up my microphones so I was forced to use the meager one that comes with the Macintosh G4. I downloaded a shareware program called Amadeus and used the test tracks from Stereophile's Test CD 3.
After attempting to minimize fan noise from the computer I ran the complete test track #17 and recorded it twice. I held the microphone about 14" from one speaker face about 1/3 up from the base. I then took the sound files and tried wave analysis on the various frequency sections.
The CD's test tones are warbled at a modulated rate of 5 Hz. Sometimes the strongest 'average' signal was a few cycles off from the CD's track. I also did linear tests from front middle and end of selections. I selected the entire section as well as what looked like smoother sections. The analysis showed a major peak as well as others. Sometimes the representative cycle was not the major peak. After taking the readings down I tried to select the most representative readings using the second file's numbers as a check. I didn't take the best readings in all cases. I include some duplicate test samples in the data to better illustrate the responses. When the 'linear' 'average' reading's peak for an entire tone was not representative of the CD, I selected a peak closer the frequency. In other cases I selected a section of the tone or took readings at the beginning, middle, or end of the sample. These were software options. Without better conditions the results should be taken in context.
The average RMS measurements were from nominally from 20 to 25 until you get lower than 40 cps. Then, it drops to 33.5 at the CD's 31.5 cps and 42.1 at the CDs 25 cps. Of course, these measurements are merely relative and indicative of the room's effects. At 40 cps and below I hear rattles coming from furniture being vibrated through the floor. The new speaker frames and point supports should improve the bass in this region.
