Let’s start the concept of sonic imagery with examining a steady-state signal-generator tone in an anechoic chamber. You would readily notice that the perceived size of the sonic image is proportional to wavelength. I.E.: High-frequencies (HFs), as in treble (E.G.: 10kHz), seem tiny & easily to pin-point due to their short wavelengths ( ¾"; 8.5mm ); low-frequencies (LFs), as in bass (E.G.: 100Hz), seem huge & harder to track back to the source due to their long wavelengths ( 6'2"; 85cm ).N.B. #1: These values are estimates as the speed of sound is dependent on temperature & humidity, which is why it also reduces with altitude.
If we stayed longer to experiment with different tones, eventually, you'd notice that determining direction happens immediately. We'll discuss part of the reasons later.N.B. #2: Since we're done discussing frequency dependence, the rest of the various waveform signals on this page are all at 1kHz for comparison purposes.
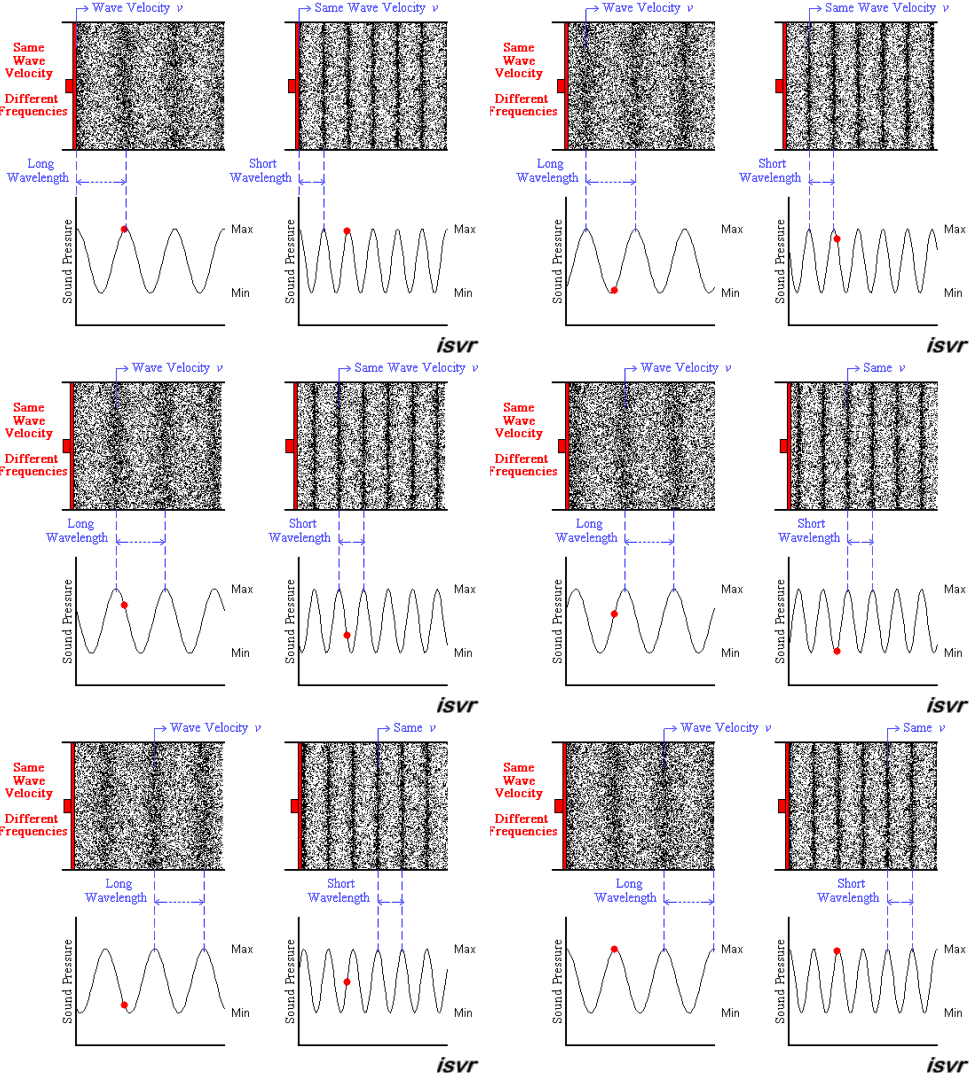
Compression & rarefaction waves. While compression is self-explanatory, rarefaction isn’t. Rarefaction waves are the opposite of compression waves. You might want to say expansion waves, but no one does. Instead it's named after the air becoming rarefied. Illustrated above we see these propagating longitudinal sound waves shown graphically, as reciprocation alternates equally compression & rarefaction waves. However, humans hear predominantly compression waves, whose magnitude is perceived logarithmically (EG: half-power is -3dB but people subjectively perceive -10dB as half-volume). They are many cases of a sustained symmetrical signals that this distinction doesn't matter, but there remain many exceptions that are crucial. Before we explore them we must define some things 1st.Harmonics. Harmonics, or overtones, are multiples of the original sinusoidal signal frequency which usually have proportional envelopes. Thus, the terms “even-order harmonics” & “odd-order harmonics” you may heard before in regard to tube amplifier total harmonic distortion (THD) for even & odd multiples, respectively; good tube amplifiers produce more even order THD than solid-state but less odd order THD. The 1st harmonic is a multiple of 2, which means it’s an even harmonic. This span also happens to correspond with a musical octave, as in one octave above the original signal. Then there’s a sub-harmonic, which is one octave below the original signal. Below is an example tabulated from a 1kHz original signal.
frequency multiple harmonic octave 500Hz ½ (sub) -1 1,000Hz 1 … 0 2,000Hz 2 1st (even) 1 3,000Hz 3 2nd (odd) 1.585 4,000Hz 4 3rd (even) 2 5,000Hz 5 4th (odd) 2.322 6,000Hz 6 5th (even) 2.585 7,000Hz 7 6th (odd) 2.807 8,000Hz 8 7th (even) 3 9,000Hz 9 8th (odd) 3.170 Fourier series. This is a set of harmonic simple sinusoidal functions that comprise a complex waveform. Say for a simplified academic exercise your instrument produces square waves. This characteristic waveform determines the majority of an instrument’s unique voice. Below, we show the construction of a square wave by consecutively adding increasing odd harmonics of ever reducing loudness. Consequently, whereas a simple sinusoid images at it's own single Fourier frequency, a square-wave of the same frequency has more pinpoint image due to its associated Fourier harmonics (much higher frequencies; much shorter wavelengths).

We can also show the analysis of these components via a plot of the magnitude vs frequency. This is often referred to as a Fast-Fourier Transform (FFT). However, those of you with equalizers may be more familiar with a similar plot called Real-Time Analysis (RTA).

f(t) = sin(ω•t) + sin(3•ω•t)/3 + sin(5•ω•t)/5 + sin(7•ω•t)/7 + sin(9•ω•t)/9 + …

f(t) = sin(ω•t) + sin(2•ω•t)/2 + sin(3•ω•t)/3 + sin(4•ω•t)/4 + sin(5•ω•t)/5 + …

f(t) = 1 + cos(ω•t) + cos(2•ω•t) + cos(3•ω•t) + cos(4•ω•t) + cos(5•ω•t) + …
Phasing, or rate of phase is important as it can alter the characteristic voices in the music. In extreme cases, it has been known to make a grand piano sound like a keyboard. This is a relative phase phenomena, or how the sound changes due to the overtones phase shifting with respect to the fundamental, regardless of how off the absolute phase is. EG: Take a 1khz sinuous tone & a smaller 2nd harmonic of 3kHz. I can coalesce the two with a shifted phase & make something resembling asquare-wave resemble a
triangular-wave.
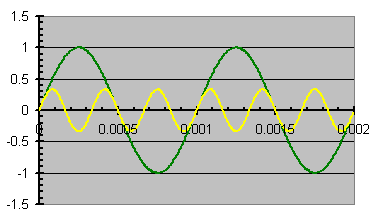
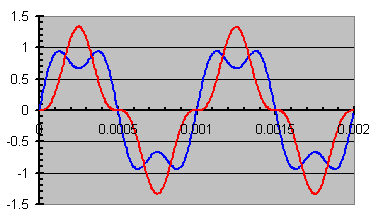
N.B. #3: The following is the Fourier series of an ideal triangular-wave. The negative sine-wave components mean an inversion from the square-wave components, or a 180º phase shift.
f(t) = sin(ω•t) - sin(3•ω•t)/3² + sin(5•ω•t)/5² - sin(7•ω•t)/7² + sin(9•ω•t)/9² - …
However, this case (@ 120º/octave) is an extreme example. In my crossover circuits experience that includes the drivers, phasing of 30º/octave is virtually undetectable. However, the absolute phase can accumulate at that phasing rate over several octaves & eventually invert the signal. “That” is audible, as we will discuss.Envelope. Up until now we were discussing the characteristic waveform of the carrier signal. Envelopes bound the magnitude of a carrier signal (shown below in green). There can be periodic envelopes like beating, which imposes their own affect on sonic imagery, but here we're interested in an exponential decay envelope of a transient signal (shown below in yellow), which is phase crucial. We can examine the following crude approximation (shown below at right).
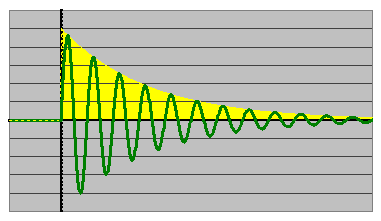
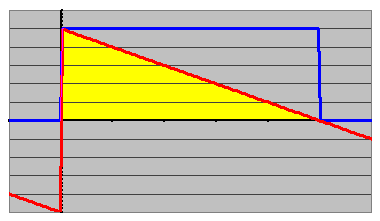
We can approximate a step function by indexing a biased extremely long period square wave by simply adding unity & halving the sum. Multiplying the steady-state signal by this step function models the semi-infinite initiation.
f(t) = ½•{ 1 + sin(ω•t) + sin(3•ω•t)/3 + sin(5•ω•t)/5 + sin(7•ω•t)/7 + … }
Furthermore, we can superimpose an approximate exponential decay by indexing a reverse-sawtooth wave.
f(t) = ⅔•{ sin(ω•t) + sin(2•ω•t)/2 + sin(3•ω•t)/3 + sin(4•ω•t)/4 + … }
Take note of all the harmonic components & how every one is a positive sine wave. That means, as we superimpose them to generate an approximate transient envelope that we can readily examine, at the crucial time when “t=0” each component is at maximum positive slope. This means they are all about to compress air. We hear every single harmonic component. It’s these HF cues that are directly coupled to the signature waveform that help really pinpoint the sonic image. It’s this aspect that is inaudible when polarity is inverted from absolute phase.Re-examining the transient envelope as a waveform, we can readily analyize the
reverse sawtooth waves. If polarity inverts, the resultant signal becomes standard
saw-tooth waves. All the compressive harmonic components become rarefactive components. Thus, these HF cues lose audibility.
Consequently in application, inverting HF cues causes otherwise holographic images sculpted in vivid depth of imagery become magnified, panoramic & shallow. A good example is a tympani drum, whose excitation transmits an initial rarefacted impulse. That means the tympani transients are inverse that of a kick-drum, whose excitation transmits an initial compressive impulse. That inversion renders a very ambient sonic signature as opposed to the concussive impact slam of a kick-drum. That's also why reverse-polarity subwoofers may seem to rumble more as they lose impact.
N.B. #4: Other cues help too like valving on horns, fretting on guitars, plucking on a violin, the slap of a drum skin, the strike on a cymbal, etc.. However, we are ignoring the relationship because they have their own transient envelopes & sonic images that already happen to coincide with the principle signal. So, for our academic purposes we’re treating them separately.
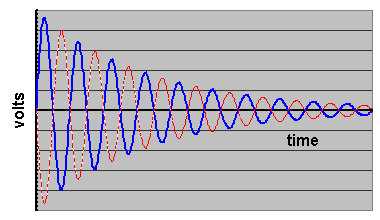
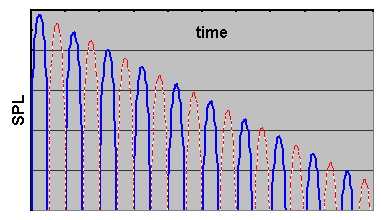
Finally, since the signal is decaying, the peak compression wave of the inverted signal is a tad quieter than the original signal. This also gives one the impression that inverted signals are about 2dB quieter. Of course this perceived discrepancy depends on the rate of decay of each signal, whose damping is unique to each & every instrument.